Company Profile
Port and Maritime Systems Simulation (PMSS) is a small independent Dutch company liaising closely with the Delft University of Technology. PMSS has an extensive record in developing and applying simulation techniques for capacity and safety assessment in ports and waterways.
We aim to bring fit for purpose advice and services of a high quality onto the market at competitive prices. We have the creativity, flexibility, energy and enthusiasm that you would expect of a small company of dedicated experts. We find effective two-way communication with our client of central importance.
We provide services to the following clients:
- engineering consultants and contractors,
- authorities responsible for the inland wet infra structure,
- the offshore industry and related authorities,
- harbour authorities and harbour operators.
Our services range from desk studies to in-depth studies applying simulation techniques and concern design, evaluation and optimisation of ports and maritime systems in terms of:
a) acceptable fleet volumes
b) dimensions of approach channels and the wet infrastructure of ports
c) number of berths or quay lengths
d) functional design of terminals
e) nautical risks
f) functional design of inland waterway systems as canal and lock systems.
To characterise the activities of PMSS hereafter a number of selected assignments and publications are mentioned. As PMSS has a close relation with the Delft University of Technology a number of studies were carried out in co-operation with this university.
Present activities of PMSS
3. Proposal simulationstudy for the ports of RasLaffan and Mesaieed, Qatar
SPECIAL ASSIGNMENTS PMSS
2017 Anaklia Port Development, Georgia
Principal:
Arcadis, Netherlands B.V.
Assigment:
Marine traffic simulation study to evaluate two development stages of the port masterpland
Since 2012 Simulation study port of Bahia Blanca, Argentine
Principal:
Siport21, Spain
Assignment:
Develop a traffic flow simulation model for the Port of Bahia Blanca and to monitor the impact of changes in future situations (traffic, admittance policy new terminals etc on the ship traffic, tug and pilot requirements.
Description:
Moreover the approach channel to the port of Bahia Blanca with a length 92 km and with 5 anchorages is very complex. Ships wait at the anchorages because of berth occupation, tidal conditions and occupation of channel sections. The anchorage use is restricted by the capacity but also by the expected waiting time, destination in the port and the vessel dimensions.
The port itself consists of three main ports viz.
1. Ingeniero White,
2. Puerto Galvan and
3. Puerto Bergrano (with the most important naval base in the Argentine).
In the present situation the port of Bahia Blanca consists of 15 terminals and is confronted with complex traffic rules.
Publication:
Development of the wet infra structure of the port of Bahia Blanca in Argentine,
PIANC World Congress San Francisco, USA 2014
2010-2011 Simulation study port Nador, Morocco
Principal:
Arcadis, The Netherlands
Assignment:
Development of a simulation model of a green field port near to Nador, consisting of a container port and an energy port.
Description:
The study has to give results on
waiting times, berth occupancies, anchorage
capacity, tug requirements and crane use depending on:
- the vessel traffic volume,
- the quay lengths,
- sailing and manoeuvring times,
- vessel traffic service(transshipment times),
- wet infra structure with traffic rules,
- disturbances due to wave and wind conditions
.
The Container Port consists in the final phase of 3 basins. Each basin has two terminals.
Each basin has two terminals, one located on the south side and the other on the north side so totally six terminals each,
with a quay length of 1800 m.
The Energy Port consists in the final phase of 6 jetties and a Multipurpose terminal with a quay length of 700 m.
Dedicated pipelines for all 11 products run over the breakwater and branch to each berth.
Each pipeline can transport only 1 dedicated product.
This means that when a ship is transshiping a product, another arriving ship with the same product has to wait until the pipeline is released.
Conclusions:
Because of the confidential character no conclusions are mentioned.
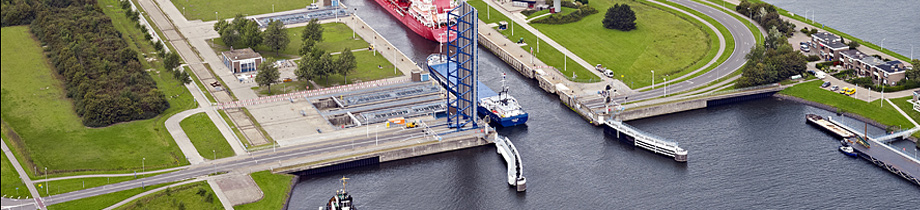
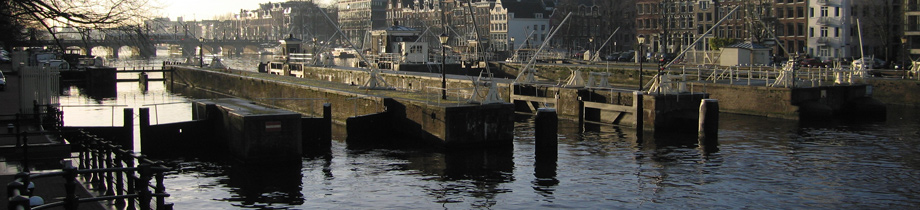
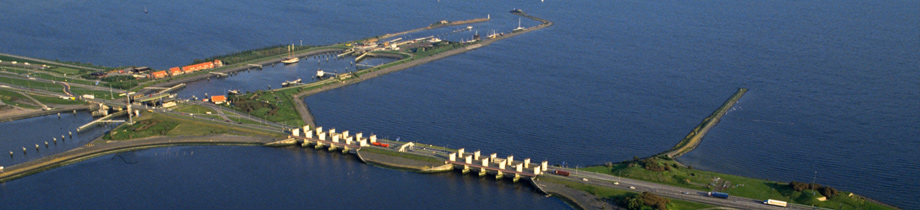
2006-2016 Simulation study Amsterdam Port approach
Principals:
Port of Amsterdam, RWS Noord-Holland, Royal HaskoningDHV, Deltaris
Assignment:
Development of a simulation model to determine:
1. the present and future capacity of the approach system with the lock complex and
2. the salt intrusion in the acces channel to the Port of Amsterdam
Description:
An approach system with a complicated lock complex, a lot of different fleet types combined with a complex wet infra structure can only be schematized as a complex system. For this reason the traffic flow simulation model “Approach Amsterdam” has been developed.
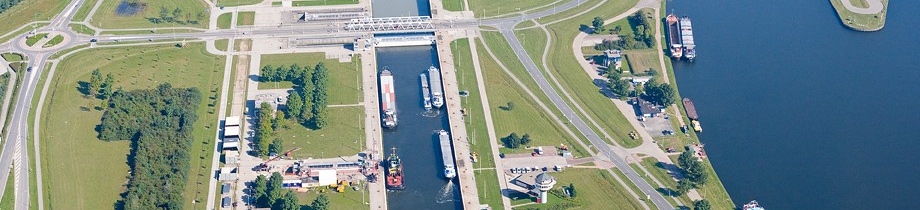
At the moment the lock complex consists of 4 locks of which 3 are used for commercial traffic. In the future a new lock will be built to enlarge the capacity and reduce the ship waiting times
2. vessels passing the lock complex coming from outer buoy;
3. vessels passing the lock complex from locations land side of the complex.
Conclusions:
1. The traffic management of the lock complex with respect to the different fleet types strongly influences the transit times and waiting times of the vessels. Therefore a careful formulation of the lock procedures is required.
2. Additional lock facilities are required when traffic volumes between 20800 and 24000 vessels are using the approach to Amsterdam.
Publication:
Simulation Study Lock Complex IJmuiden, MTEC September 2007, Singapore.
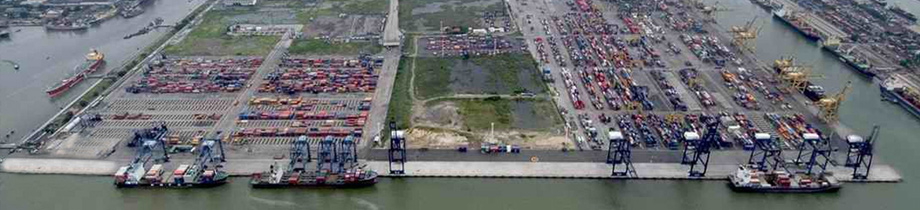
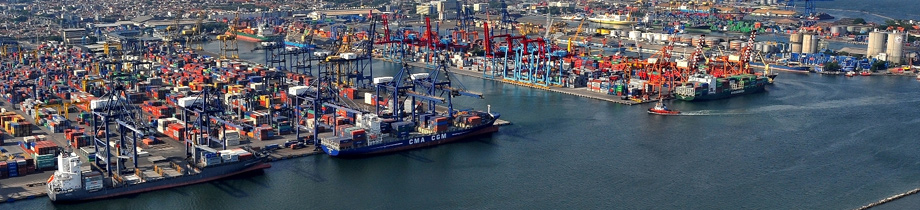
2004-2006 Traffic flow simulation study Maasvlakte II and Simulation studies Maasvlakte II with the influence of LNG-carriers on waiting times
Principal:
Port of Rotterdam
Assignment:
Development of a simulation model to register ship-waiting times and turnaround times as a function of the traffic volume, applied ship traffic rules and safety distances.
Determine the influence of the establishment of the LNG terminals on ship waiting times.
Description:
The objectives of the port of Rotterdam with respect to the port extension are a safe and smooth handling of the marine traffic. This is translated in two main objectives:
1. safe means that that the present safety level should be maintained and
2. smooth means that the service level should fulfil the demands of the ship owners.
The safety level can be secured by maintaining or if necessary by extending traffic rules. The service level, mostly identified with ship waiting times, is influenced by berth occupancy and occupancy of the wet infra structure. As stated if the safety level of the port is too low, traffic rules can be extended but by extending the traffic rules most probably waiting times will go up and with that the service level will go down.
As for most ports in the world a lot of parameters are controlling the ship traffic and many parameters are stochastic of nature. Together with the complexity of the Port of Rotterdam this necessitates the application of probabilistic traffic flow simulation model.
Model Specification
For the simulation of the marine traffic the wet infra structure should be subdivided in a number of port sections. The subdivision should be done in such a way that one set of ship traffic rules can be applied for a port section. This subdivision of simulated part of the port of Rotterdam is given in the figure below.
For each terminal destination fleet generators were inserted, totally 36 ship generators are required.
Conclusions:
Because of the confidential character no conclusions are mentioned.
Publication:
Ship Traffic Simulation Study Port Extension Maasvlakte 2 of the Port of Rotterdam, PIANC congress May 2006, Portugal Estoril.
2002 Simulation model tug services in the port of Rotterdam
Principal:
SMIT Harbour Towage Rotterdam B.V., The Netherlands
Assignment:
Development a simulation model for the estimation of efficiency of tug services in the port of Rotterdam
Conclusions:
Because of the confidential character no conclusions are mentioned.
2001 Simulation study capacity estimation lock complex IJnuiden,The Netherlands
Principal:
Directorate General for Public Works and Water Management, The Netherlands
Assignment:
Second opinion study on the necessity of an addition lock chamber in the lock complex IJmuiden, accommodating the ship traffic to the port of Amsterdam.
Conclusion:
Because of the confidential character no conclusions are mentioned.
1998 Vessel Traffic Simulation Study Port of Ruwais, United Arab Emirates
Principals:
Hydrodynamic,
Abu Dhabi National Oil Company (ADNOC)
Assignment:
Develop a dedicated simulation model of the marine traffic between Gasha Beacon (outer buoy) and the terminals of Ruwais and the SPM's of Jebel Dhanna, to identify the problems that may arise in the coming 25 years. Also risk levels caused by the traffic increase should be estimated.
Description:
A model of the marine traffic system between Gasha Beacon and Jebel Dhanna with more than 18 fleets and a complex system of approach channels with terminals and the SPM's was developed.
Conclusions:
-
In general it was concluded that the capacity approach channel to Jebel Dhanna and the Ruwais complex of terminals is sufficient for all phases simulated and doesn't influence the functioning of the terminals.
-
For the phases 2005- 2025 additional berths and new terminals have to be built so satisfy the demands of the ship traffic resulting from the prognosis of the different commodity throughput.
1996 Vessel traffic simulation study, Jamnagar Refinery Complex, Gujarat, India
Principal: Delft Hydraulics, Delft
Reliance Petroleum, India
Assignment:
- Develop a dedicated simulation model to identify ship-waiting times on arrival and departure for a number of terminal configurations with related traffic volumes.
- Developed a model to evaluate the impact of the increase of the ship traffic in the Gulf of Kutch on safety aspects.
Description:
The first simulation study had to specify waiting times berths occupancies, required anchorage capacity depending on:
1. vessel traffic volume,
2. the number of berths,
3. the number of different product tankers to be accommodated per berth,
4. tidal window,
5. possibility of day and night navigation,
6.sailing and manoeuvring times,
7. vessel service times.
In the second simulation study the impact of traffic increase by the development of the Reliance Petroleum Marine Terminal was evaluated on safety aspects. To this end the number of encounters in the most critical channel sections of the Gulf of Kutch have been registered.
Some conclusions:
-
For a number of development phases some berth occupancies and waiting times of product tankers were rather high and it was recommended to increase the number of berths or to increase the flexibility of the mooring facilities for the vessels.
-
Although a steep increase of the number of encounters were registered no major problems with respect to safety were expected, as the Gulf of Kutch is a spacious and deep fairway in this area.
1986 Bahia Blanca estuary.
Principal:
DHV Consulting Engineers, Amersfoort, The Netherlands
Assignment:
Simulation investigation on the necessary number of berths and transshipment capacity for the grain terminals in Puerto Ing. White. With maximum draughts of the approach channel (40', 45’ and 50') and the traffic volume of the year 2000.
The assignment was carried out in cooperation with Delft University of Technology.
Description:
The problems were mainly due to the fact of inadequate quay length and transshipment capacity while the approach channel of 75 km caused nautical problems by its confined water depth.
Six ports and or terminals were inserted in the simulation model.
The complicated approach channel consists of an outer channel with 7 sections and an inner channel with 6 sections. Sections of the approach channel are one way, two way, conditional two way and turning basins.
The following ship types were generated:
grain carriers, crude carriers, reefers, oil product carriers and general cargo vessels.
To determine ship-waiting times by tidal conditions the water levels during spring tide and neap tide have been inserted for each channel section.
Recommendations
-
Nautical channel depth 45'
-
Three berths and 1 layby berth for leaving grain carriers when dealing with a transshipment capacity of 1500 t/hr/berth or
-
Three berths, no layby berth for leaving grain carriers and a transshipment capacity of 1800 t/hr/berth.
Publication:
Economic optimization of the wet infrastructure in developing countries with capacity simulation models, Ir. R. Groenveld and Prof. W. Winkelmans.
Conference on Coastal and Port Engineering in Developing Countries (COPEDEC), Beijing, China, 1987.